PAGE 1/18 Environmental Product Declaration Protection Plates from Hager® Programme: The International EPD® System, www.environdec.com Programme operator: EPD International AB Licensee: EPD North America (www.epdna.com) EPD registration number: EPD-IES-0027616:001 Publication date: 2026-01-16 Valid until: 2031-01-16 An EPD should provide current information and may be updated if conditions change. The stated validity is therefore subject to the continued registration and publication at www.environdec.com This EPD was done in accordance with ISO 14025 and ISO 21930. This EPD does not comply with EN15804+A2.
PAGE 2/18 General information Programme information Program: The International EPD® System Address: EPD International AB Box 210 60 SE-100 31 Stockholm Sweden Website: www.environdec.com E-mail: support@environdec.com Accountabilities for PCR, LCA and independent, third-party verification General Programme Instructions1 General Programme Instructions for the International EPD® System. Version 5.0. 2024-06-19 Product Category Rules (PCR)2 UL Part A: Life Cycle Assessment Calculation Rules and Report Requirements. Version 4.0. 2022-03-28 UL Part B: Builders Hardware EPD Requirements Version 2.0. 2025-08-19 Part B PCR review was conducted by: Lindita Bushi (Athena Sustainable Materials Institute), Jim Mellentine (Ramboll), Daniel Picard (ASSA ABLOY Openings Solutions) Life Cycle Assessment (LCA) This life cycle assessment was conducted in accordance with ISO 14044 and the reference PCR by: WAP Sustainability Consulting Third-party verification This declaration was independently verified in accordance with ISO 14025: 2006. The UL Environment “Part A: Calculation Rules for the Life Cycle Assessment and Requirements on the Project Report,” v4.0 (March, 2022), based on ISO 21930:2017, serves as the core PCR. ☒ EPD verification by individual verifier ☐ INTERNAL ☒ EXTERNAL Third-party verifier: Freddy Navarro, LCACHECK S.A.S. de C.V. Approved by: The International EPD® System Procedure for follow-up of data during EPD validity involves third party verifier: ☐ Yes ☒ No The EPD owner has the sole ownership, liability, and responsibility for the EPD. EPDs within the same product category but registered in different EPD programmes, or not compliant with EN 15804, may not be comparable. For two EPDs to be comparable, they must be based on the same PCR (including the same version number) or be based on fully-aligned PCRs or versions of PCRs; cover products with identical functions, technical performances and use (e.g. identical declared/functional units); have equivalent system boundaries and descriptions of data; apply equivalent data quality requirements, methods of data collection, and allocation methods; apply identical cut-off rules and impact assessment methods (including the same version of characterization factors); have equivalent content declarations; and be valid at the time of comparison. For further information about comparability, see EN 15804 and ISO 14025. Comparison of the environmental performance of products using EPD information shall be based on the product’s use and impacts at the construction works level, and therefore EPDs may not be used for comparability purposes when not considering the construction works energy use phase as instructed under this PCR. In general, EPDs may not be used for comparability purposes when not considered in a construction works context. Given this PCR (UL Part B: Builders Hardware EPD Requirements Version 1.0. 2019-11-15) ensures products meet the same functional requirements, comparability is permissible provided the information given for such comparison is transparent and the limitations of comparability explained. When comparing EPDs created using this PCR, variations and deviations are possible. Full conformance with the PCR for Builders Hardware allows EPD comparability only when all stages of a life cycle have been considered, when they comply with all referenced standards, use the same sub-category Part B PCR, and use equivalent scenarios with respect to construction works. However, variations and deviations are possible. Example of variations: Different LCA software and background LCI datasets may lead to different results for upstream or downstream of the life cycle stages declared. 1 Not all requirements in the GPI are fulfilled, particularly the requirement, for construction products, to follow EN 15804 for certain aspects of the LCA method. 2 This EPD is based on a PCR that satisfies market expectations (example: Building Transparency EC3 comparisons, LEED and existing vendor procurement requirements, product scoring programs, etc.). The EPD should not be used outside of this context.
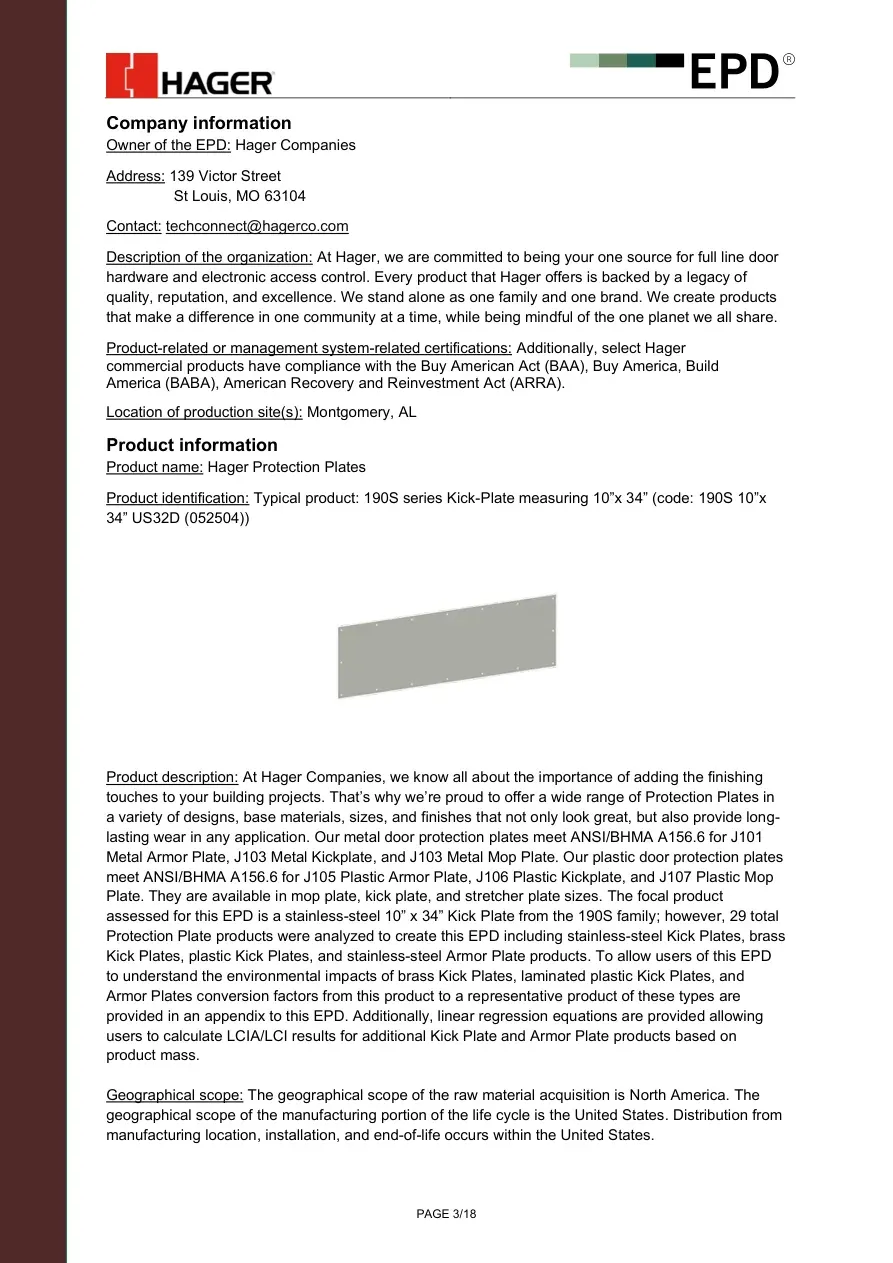
PAGE 3/18 Company information Owner of the EPD: Hager Companies Address: 139 Victor Street St Louis, MO 63104 Contact: techconnect@hagerco.com Description of the organization: At Hager, we are committed to being your one source for full line door hardware and electronic access control. Every product that Hager offers is backed by a legacy of quality, reputation, and excellence. We stand alone as one family and one brand. We create products that make a difference in one community at a time, while being mindful of the one planet we all share. Product-related or management system-related certifications: Additionally, select Hager commercial products have compliance with the Buy American Act (BAA), Buy America, Build America (BABA), American Recovery and Reinvestment Act (ARRA). Location of production site(s): Montgomery, AL Product information Product name: Hager Protection Plates Product identification: Typical product: 190S series Kick-Plate measuring 10”x 34” (code: 190S 10”x 34” US32D (052504)) Product description: At Hager Companies, we know all about the importance of adding the finishing touches to your building projects. That’s why we’re proud to offer a wide range of Protection Plates in a variety of designs, base materials, sizes, and finishes that not only look great, but also provide long-lasting wear in any application. Our metal door protection plates meet ANSI/BHMA A156.6 for J101 Metal Armor Plate, J103 Metal Kickplate, and J103 Metal Mop Plate. Our plastic door protection plates meet ANSI/BHMA A156.6 for J105 Plastic Armor Plate, J106 Plastic Kickplate, and J107 Plastic Mop Plate. They are available in mop plate, kick plate, and stretcher plate sizes. The focal product assessed for this EPD is a stainless-steel 10” x 34” Kick Plate from the 190S family; however, 29 total Protection Plate products were analyzed to create this EPD including stainless-steel Kick Plates, brass Kick Plates, plastic Kick Plates, and stainless-steel Armor Plate products. To allow users of this EPD to understand the environmental impacts of brass Kick Plates, laminated plastic Kick Plates, and Armor Plates conversion factors from this product to a representative product of these types are provided in an appendix to this EPD. Additionally, linear regression equations are provided allowing users to calculate LCIA/LCI results for additional Kick Plate and Armor Plate products based on product mass. Geographical scope: The geographical scope of the raw material acquisition is North America. The geographical scope of the manufacturing portion of the life cycle is the United States. Distribution from manufacturing location, installation, and end-of-life occurs within the United States.
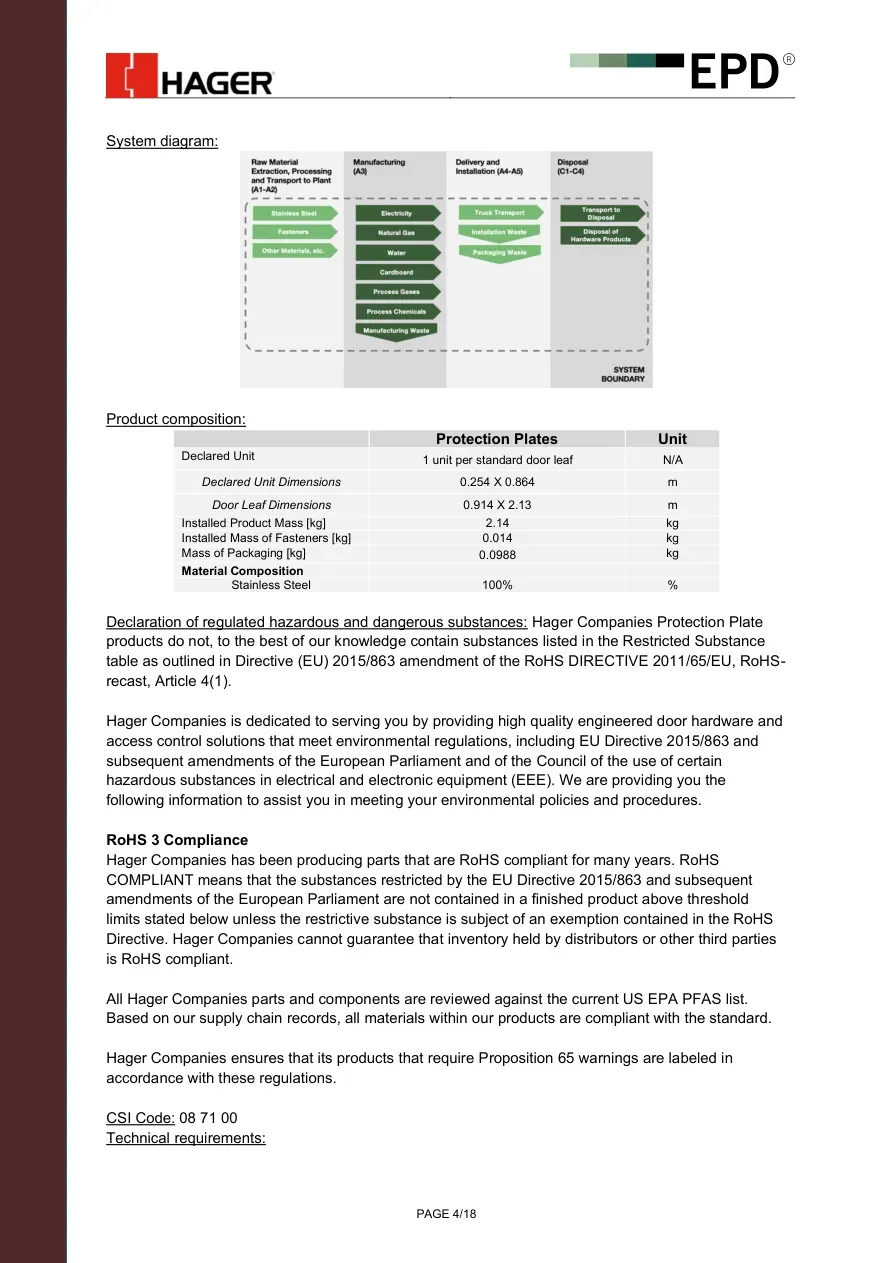
PAGE 4/18 System diagram: Product composition: Protection Plates Unit Declared Unit 1 unit per standard door leaf N/A Declared Unit Dimensions 0.254 X 0.864 m Door Leaf Dimensions 0.914 X 2.13 m Installed Product Mass [kg] 2.14 kg Installed Mass of Fasteners [kg] 0.014 kg Mass of Packaging [kg] 0.0988 kg Material Composition Stainless Steel 100% % Declaration of regulated hazardous and dangerous substances: Hager Companies Protection Plate products do not, to the best of our knowledge contain substances listed in the Restricted Substance table as outlined in Directive (EU) 2015/863 amendment of the RoHS DIRECTIVE 2011/65/EU, RoHS-recast, Article 4(1). Hager Companies is dedicated to serving you by providing high quality engineered door hardware and access control solutions that meet environmental regulations, including EU Directive 2015/863 and subsequent amendments of the European Parliament and of the Council of the use of certain hazardous substances in electrical and electronic equipment (EEE). We are providing you the following information to assist you in meeting your environmental policies and procedures. RoHS 3 Compliance Hager Companies has been producing parts that are RoHS compliant for many years. RoHS COMPLIANT means that the substances restricted by the EU Directive 2015/863 and subsequent amendments of the European Parliament are not contained in a finished product above threshold limits stated below unless the restrictive substance is subject of an exemption contained in the RoHS Directive. Hager Companies cannot guarantee that inventory held by distributors or other third parties is RoHS compliant. All Hager Companies parts and components are reviewed against the current US EPA PFAS list. Based on our supply chain records, all materials within our products are compliant with the standard. Hager Companies ensures that its products that require Proposition 65 warnings are labeled in accordance with these regulations. CSI Code: 08 71 00 Technical requirements:
PAGE 5/18 • ANSI/BHMA A156.6 Architectural Door Trim– Certified LCA information Declared unit: 1 unit of Protection Plate measuring 10” X 34” (0.254 X 0.864 m) in length per standard door leaf measuring 3’x 7’ (0.914 X 2.13 m). Description of product intended application and use: Hager Protection Plates are available for many types of door applications, including commercial applications such as offices, retail spaces, and healthcare and educational institutions. Market of applicability: United States Year of reported manufacturer primary data: Primary data were provided by the manufacturer and represent all information for calendar year 2023. Database(s) and LCA software used: MLC Database 2024.2 and LCA FE 10.9 software. LCIA Methodology & Version Number: IPCC AR5 GWP 100, TRACI 2.1, CML v4.7 EPD type: EPD of typical product Description of system boundaries: Cradle-to-gate with options, modules A1-A3 and C1-C4 are included in this study. Manufacturing: Hager receives metal and plastic parts from suppliers. Subsequently, these parts are laser cut or stamped, milled, and hole punched at the facility via automated processes. Subsequently, the product undergoes manual deburring, edging, and final assembly. Metal waste is created throughout the process. This is captured and sent to recyclers. Products are then packaged with fasteners and shipped to either distributors or end customers. Electricity: The electricity is sourced from the power grid, and no onsite electricity generation is used. Sub-meter specific electricity values were not available from the manufacturing facility. Annual electricity consumption was normalized to the declared unit using the allocation methodology described below. The emissions associated with the modeled grid mix as used in the LCA are 0.509 kg CO2 eq per kWh using the IPCC AR5 impact assessment methodology. Utilities: Manufacturing electricity is sourced from the power grid, and no onsite electricity generation is used. Utilities used in the manufacturing process are purchased from third parties. Sub-meter specific utility consumption values were not available from the manufacturing facility. As such, annual consumption was normalized to the declared unit using the allocation methodology described below. Installation: During installation, product packaging is disposed of. Packaging scrap is disposed of following the appropriate scenarios defined in the PCRs guiding this study. Some packaging waste is assumed to be sent to incineration with the total energy efficiency of incineration considered to be 21.4% (below the value required to be considered incineration with energy recovery). Flows of exported energy are accounted for; however, given that Module D is excluded from this study no crediting is given to this product system from exported energy. There is no additional product scrap generated during installation. End of life: At the product’s end of life, the product can be manually disassembled. End-of-life scenarios for the product was modeled according to UL Part A end-of-life assumptions (Section 2.8.5) in the United States.
PAGE 6/18 Assumptions: Throughout this study, value choices and judgments that may have affected the LCA have been described. Additional decisions are summarized below: • The inclusion of overhead energy data was determined appropriate and included as part of the facility energy data. • Similarly, manufacturing inputs and outputs were assumed to be the same on a per unit basis across all products in the same product line. Product scrap waste was calculated for products based on specification. • The products covered in this EPD are sold in several varieties which primarily vary in size, finish, shape, and fastener package. Regardless of the product size, product lines are manufactured from the same materials and have the same production process. • Different numbers of products can be packaged together and packaging can differ. Some products may be packaged more frequently in a certain way. For simplicity, a single packaging scenario was assumed. • Secondary datasets from Sphera’s MLC database were used within the study. The selection of which generic dataset to use to represent an aspect of a supply chain is a significant value choice. Cut-off Rules: All inputs and outputs to unit processes for which data are available are included in the assessment. When data was not available, average, generic, or proxy data from the MLC database was utilized. A cut-off rule of 1% is considered in this assessment. This rule dictates that the included inventory data accounts for greater than 99% of the total material and energy inputs to the system. Furthermore, greater than 99% of the environmental impacts are presumed to have been modeled based on the assessor’s best judgment of excluded inputs. All substances with hazardous and toxic properties that can be of concern for human health and/or the environment have been identified, if present in the product, and declared according to normative requirements in standards or regulations applicable in the market for which the EPD is valid, even if the given process unit is under the cut-off criterion. The list of excluded materials and energy inputs include: • Some material inputs may have been excluded within the Sphera MLC datasets used for this project. All Sphera MLC datasets have been critically reviewed and conform to the exclusion requirement of the PCR. • Emissions from the production of manufacturing facilities and equipment were excluded from this study. • Some ancillary or finishing materials below the cutoff may have been excluded. Data Quality: The geographic coverage, time coverage, and technological coverage are all good. The precision, consistency, and reproducibility are all high and the model is considered complete. The quality of the data has been assessed according to the standards outlined in the PCRs governing this study. Using these relevant metrics overall, the data quality for this LCA is considered good. Allocation: General principles of allocation were based on ISO 14040/44. There is currently no sub-metering at the manufacturing facility. To derive a per-unit value for manufacturing inputs and outputs such as electricity, water, and manufacturing waste, a two-step allocation process was undertaken. The first step was allocation from facility-wide values to product-category specific quantities. This accounted for the fact that different product types (e.g., hinges vs. trim) undergo different processes (e.g., metal bending and plating vs. just cutting) at Hager’s facility. For this step, allocation based on financial data as informed by Hager Companies accounting associates was undertaken. The result of this step was the proportional division of total utility inputs across various product categories. From these product category pools, allocation based on total production units within each category was adopted. This was deemed appropriate given that the primary processes occurring within Hager’s®
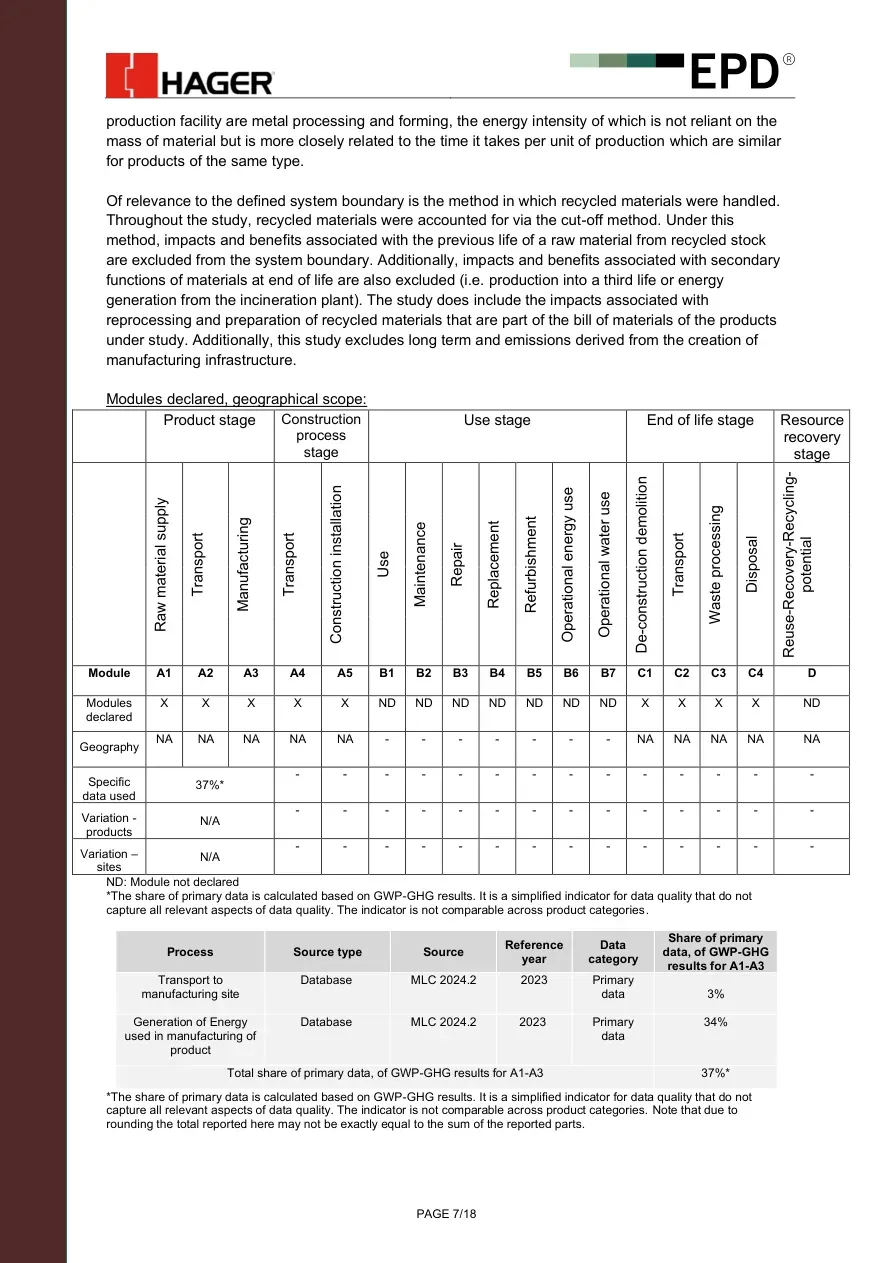
PAGE 7/18 production facility are metal processing and forming, the energy intensity of which is not reliant on the mass of material but is more closely related to the time it takes per unit of production which are similar for products of the same type. Of relevance to the defined system boundary is the method in which recycled materials were handled. Throughout the study, recycled materials were accounted for via the cut-off method. Under this method, impacts and benefits associated with the previous life of a raw material from recycled stock are excluded from the system boundary. Additionally, impacts and benefits associated with secondary functions of materials at end of life are also excluded (i.e. production into a third life or energy generation from the incineration plant). The study does include the impacts associated with reprocessing and preparation of recycled materials that are part of the bill of materials of the products under study. Additionally, this study excludes long term and emissions derived from the creation of manufacturing infrastructure. Modules declared, geographical scope: Product stage Construction process stage Use stage End of life stage Resource recovery stage Raw material supply Transport Manufacturing Transport Construction installation Use Maintenance Repair Replacement Refurbishment Operational energy use Operational water use De-construction demolition Transport Waste processing Disposal Reuse-Recovery-Recycling-potential Module A1 A2 A3 A4 A5 B1 B2 B3 B4 B5 B6 B7 C1 C2 C3 C4 D Modules declared X X X X X ND ND ND ND ND ND ND X X X X ND Geography NA NA NA NA NA - - - - - - - NA NA NA NA NA Specific data used 37%* - - - - - - - - - - - - - - Variation - products N/A - - - - - - - - - - - - - - Variation – sites N/A - - - - - - - - - - - - - - ND: Module not declared *The share of primary data is calculated based on GWP-GHG results. It is a simplified indicator for data quality that do not capture all relevant aspects of data quality. The indicator is not comparable across product categories. Process Source type Source Reference year Data category Share of primary data, of GWP-GHG results for A1-A3 Transport to manufacturing site Database MLC 2024.2 2023 Primary data 3% Generation of Energy used in manufacturing of product Database MLC 2024.2 2023 Primary data 34% Total share of primary data, of GWP-GHG results for A1-A3 37%* *The share of primary data is calculated based on GWP-GHG results. It is a simplified indicator for data quality that do not capture all relevant aspects of data quality. The indicator is not comparable across product categories. Note that due to rounding the total reported here may not be exactly equal to the sum of the reported parts.
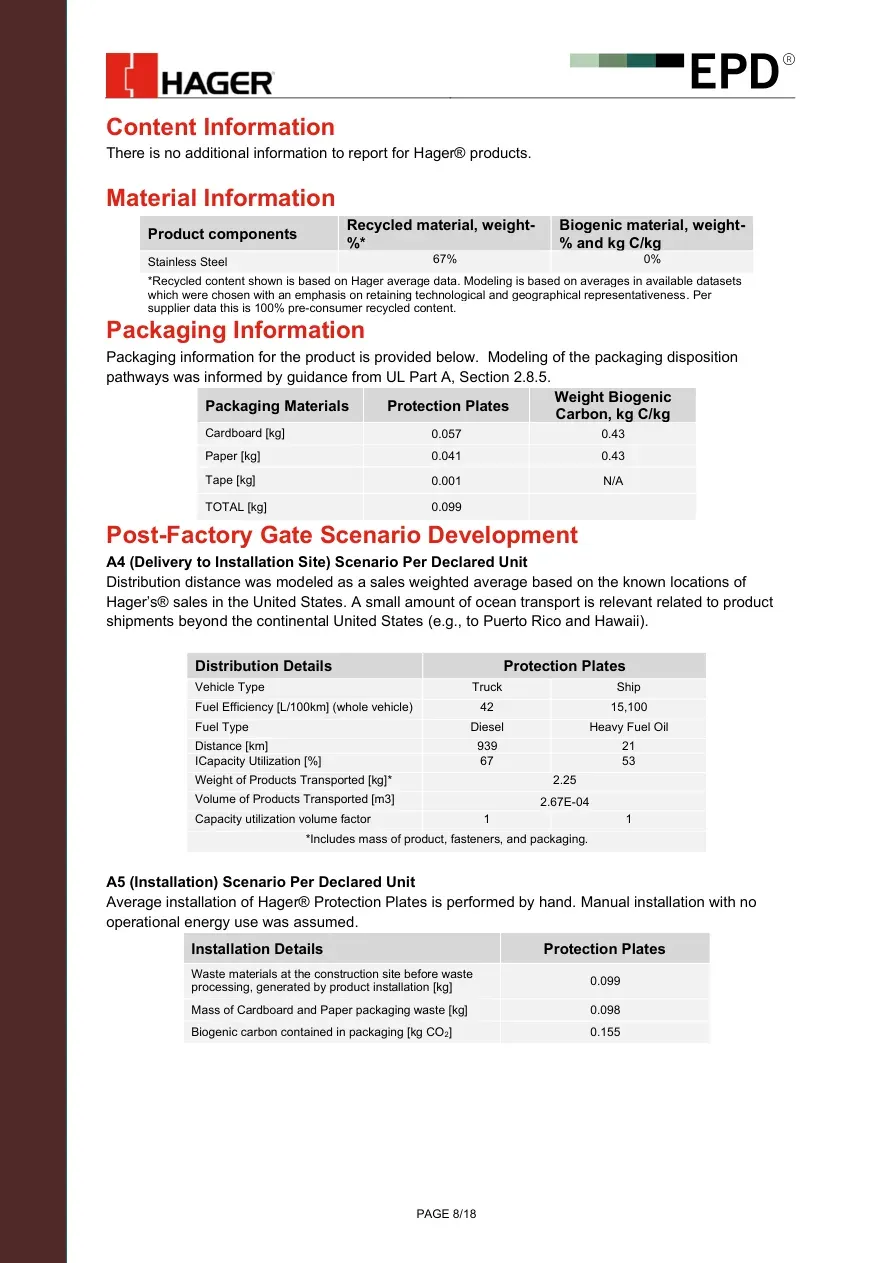
PAGE 8/18 Content Information There is no additional information to report for Hager® products. Material Information Product components Recycled material, weight-%* Biogenic material, weight-% and kg C/kg Stainless Steel 67% 0% *Recycled content shown is based on Hager average data. Modeling is based on averages in available datasets which were chosen with an emphasis on retaining technological and geographical representativeness. Per supplier data this is 100% pre-consumer recycled content. Packaging Information Packaging information for the product is provided below. Modeling of the packaging disposition pathways was informed by guidance from UL Part A, Section 2.8.5. Packaging Materials Protection Plates Weight Biogenic Carbon, kg C/kg Cardboard [kg] 0.057 0.43 Paper [kg] 0.041 0.43 Tape [kg] 0.001 N/A TOTAL [kg] 0.099 Post-Factory Gate Scenario Development A4 (Delivery to Installation Site) Scenario Per Declared Unit Distribution distance was modeled as a sales weighted average based on the known locations of Hager’s® sales in the United States. A small amount of ocean transport is relevant related to product shipments beyond the continental United States (e.g., to Puerto Rico and Hawaii). Distribution Details Protection Plates Vehicle Type Truck Ship Fuel Efficiency [L/100km] (whole vehicle) 42 15,100 Fuel Type Diesel Heavy Fuel Oil Distance [km] 939 21 ICapacity Utilization [%] 67 53 Weight of Products Transported [kg]* 2.25 Volume of Products Transported [m3] 2.67E-04 Capacity utilization volume factor 1 1 *Includes mass of product, fasteners, and packaging. A5 (Installation) Scenario Per Declared Unit Average installation of Hager® Protection Plates is performed by hand. Manual installation with no operational energy use was assumed. Installation Details Protection Plates Waste materials at the construction site before waste processing, generated by product installation [kg] 0.099 Mass of Cardboard and Paper packaging waste [kg] 0.098 Biogenic carbon contained in packaging [kg CO2] 0.155
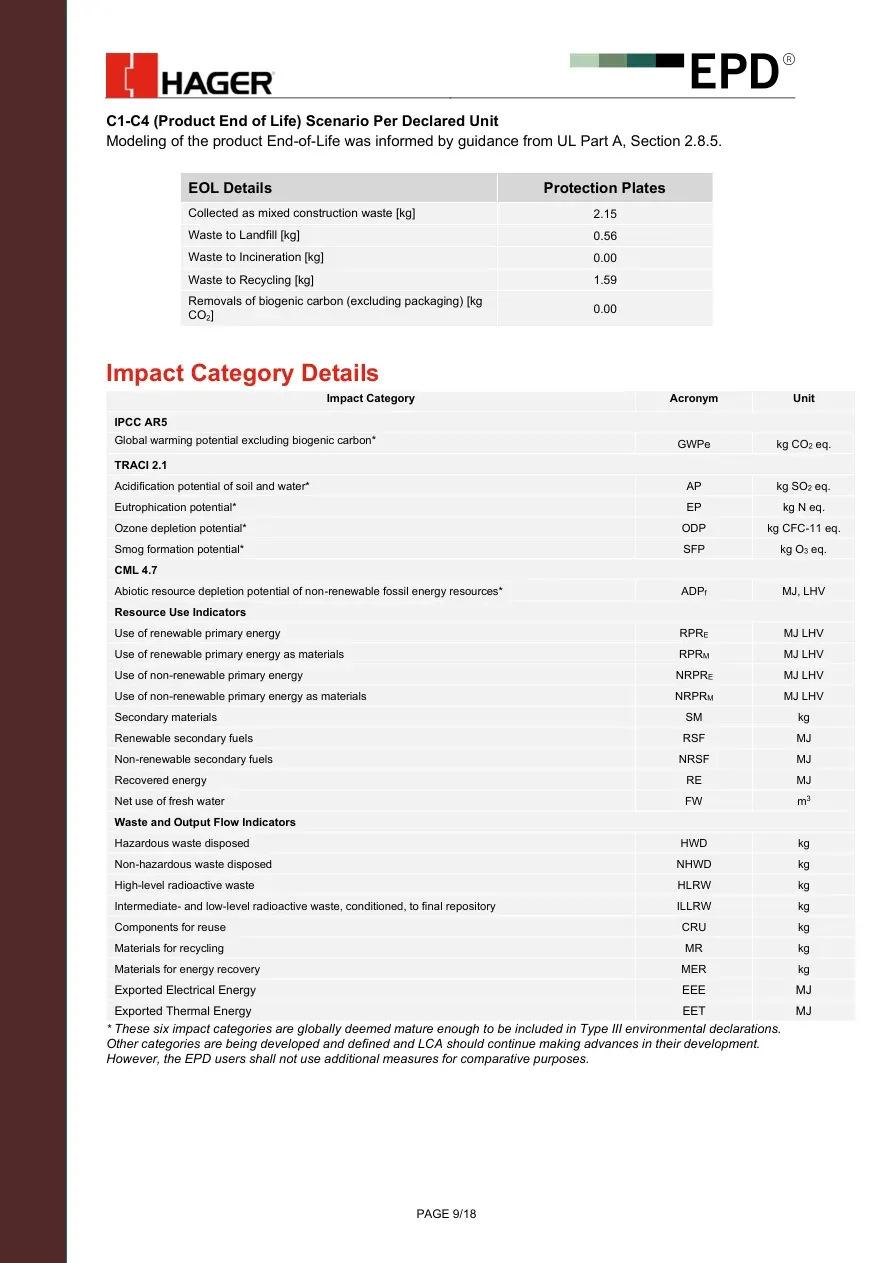
PAGE 9/18 C1-C4 (Product End of Life) Scenario Per Declared Unit Modeling of the product End-of-Life was informed by guidance from UL Part A, Section 2.8.5. EOL Details Protection Plates Collected as mixed construction waste [kg] 2.15 Waste to Landfill [kg] 0.56 Waste to Incineration [kg] 0.00 Waste to Recycling [kg] 1.59 Removals of biogenic carbon (excluding packaging) [kg CO2] 0.00 Impact Category Details Impact Category Acronym Unit IPCC AR5 Global warming potential excluding biogenic carbon* GWPe kg CO2 eq. TRACI 2.1 Acidification potential of soil and water* AP kg SO2 eq. Eutrophication potential* EP kg N eq. Ozone depletion potential* ODP kg CFC-11 eq. Smog formation potential* SFP kg O3 eq. CML 4.7 Abiotic resource depletion potential of non-renewable fossil energy resources* ADPf MJ, LHV Resource Use Indicators Use of renewable primary energy RPRE MJ LHV Use of renewable primary energy as materials RPRM MJ LHV Use of non-renewable primary energy NRPRE MJ LHV Use of non-renewable primary energy as materials NRPRM MJ LHV Secondary materials SM kg Renewable secondary fuels RSF MJ Non-renewable secondary fuels NRSF MJ Recovered energy RE MJ Net use of fresh water FW m3 Waste and Output Flow Indicators Hazardous waste disposed HWD kg Non-hazardous waste disposed NHWD kg High-level radioactive waste HLRW kg Intermediate- and low-level radioactive waste, conditioned, to final repository ILLRW kg Components for reuse CRU kg Materials for recycling MR kg Materials for energy recovery MER kg Exported Electrical Energy EEE MJ Exported Thermal Energy EET MJ * These six impact categories are globally deemed mature enough to be included in Type III environmental declarations. Other categories are being developed and defined and LCA should continue making advances in their development. However, the EPD users shall not use additional measures for comparative purposes.
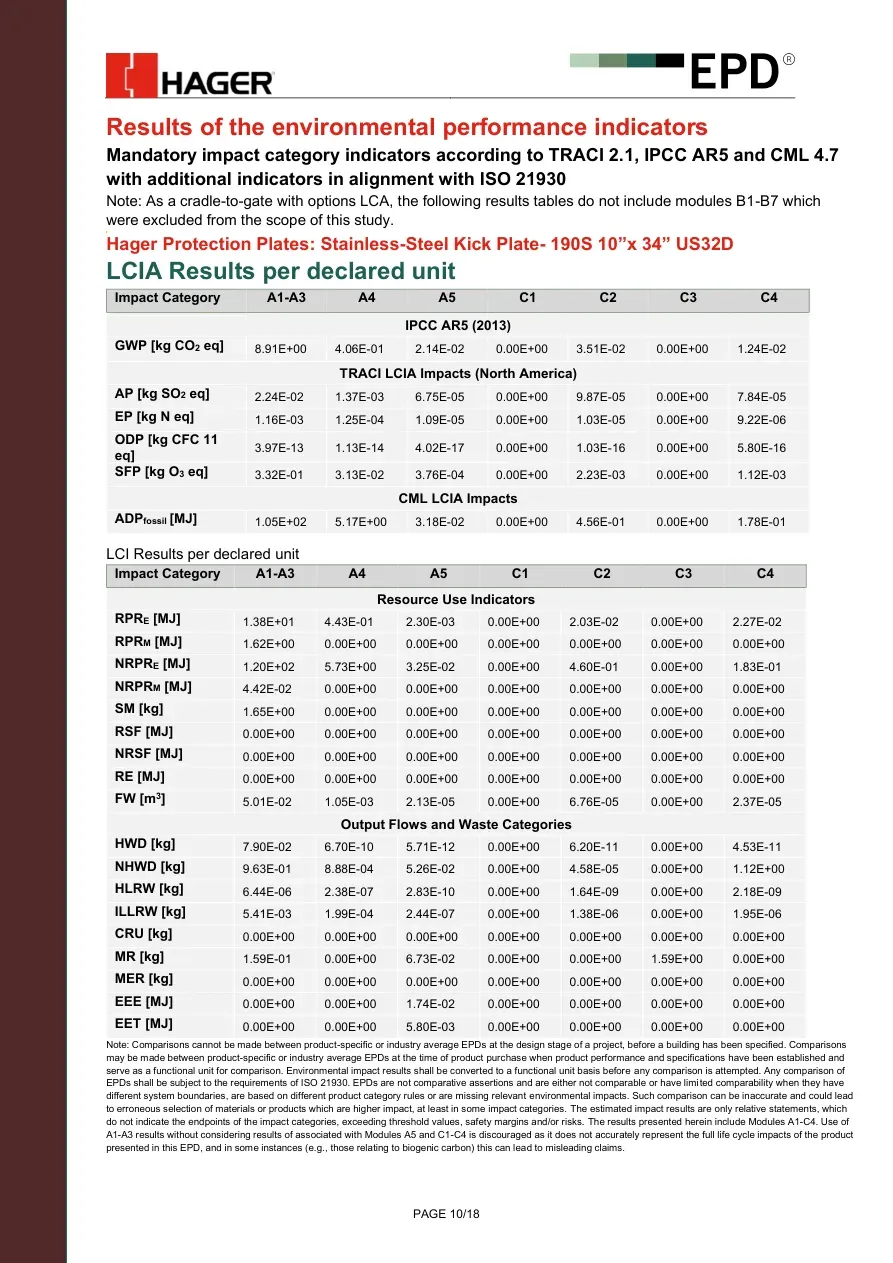
PAGE 10/18 Results of the environmental performance indicators Mandatory impact category indicators according to TRACI 2.1, IPCC AR5 and CML 4.7 with additional indicators in alignment with ISO 21930 Note: As a cradle-to-gate with options LCA, the following results tables do not include modules B1-B7 which were excluded from the scope of this study. S Hager Protection Plates: Stainless-Steel Kick Plate- 190S 10”x 34” US32D LCIA Results per declared unit Impact Category A1-A3 A4 A5 C1 C2 C3 C4 IPCC AR5 (2013) GWP [kg CO2 eq] 8.91E+00 4.06E-01 2.14E-02 0.00E+00 3.51E-02 0.00E+00 1.24E-02 TRACI LCIA Impacts (North America) AP [kg SO2 eq] 2.24E-02 1.37E-03 6.75E-05 0.00E+00 9.87E-05 0.00E+00 7.84E-05 EP [kg N eq] 1.16E-03 1.25E-04 1.09E-05 0.00E+00 1.03E-05 0.00E+00 9.22E-06 ODP [kg CFC 11 eq] 3.97E-13 1.13E-14 4.02E-17 0.00E+00 1.03E-16 0.00E+00 5.80E-16 SFP [kg O3 eq] 3.32E-01 3.13E-02 3.76E-04 0.00E+00 2.23E-03 0.00E+00 1.12E-03 CML LCIA Impacts ADPfossil [MJ] 1.05E+02 5.17E+00 3.18E-02 0.00E+00 4.56E-01 0.00E+00 1.78E-01 LCI Results per declared unit Impact Category A1-A3 A4 A5 C1 C2 C3 C4 Resource Use Indicators RPRE [MJ] 1.38E+01 4.43E-01 2.30E-03 0.00E+00 2.03E-02 0.00E+00 2.27E-02 RPRM [MJ] 1.62E+00 0.00E+00 0.00E+00 0.00E+00 0.00E+00 0.00E+00 0.00E+00 NRPRE [MJ] 1.20E+02 5.73E+00 3.25E-02 0.00E+00 4.60E-01 0.00E+00 1.83E-01 NRPRM [MJ] 4.42E-02 0.00E+00 0.00E+00 0.00E+00 0.00E+00 0.00E+00 0.00E+00 SM [kg] 1.65E+00 0.00E+00 0.00E+00 0.00E+00 0.00E+00 0.00E+00 0.00E+00 RSF [MJ] 0.00E+00 0.00E+00 0.00E+00 0.00E+00 0.00E+00 0.00E+00 0.00E+00 NRSF [MJ] 0.00E+00 0.00E+00 0.00E+00 0.00E+00 0.00E+00 0.00E+00 0.00E+00 RE [MJ] 0.00E+00 0.00E+00 0.00E+00 0.00E+00 0.00E+00 0.00E+00 0.00E+00 FW [m3] 5.01E-02 1.05E-03 2.13E-05 0.00E+00 6.76E-05 0.00E+00 2.37E-05 Output Flows and Waste Categories HWD [kg] 7.90E-02 6.70E-10 5.71E-12 0.00E+00 6.20E-11 0.00E+00 4.53E-11 NHWD [kg] 9.63E-01 8.88E-04 5.26E-02 0.00E+00 4.58E-05 0.00E+00 1.12E+00 HLRW [kg] 6.44E-06 2.38E-07 2.83E-10 0.00E+00 1.64E-09 0.00E+00 2.18E-09 ILLRW [kg] 5.41E-03 1.99E-04 2.44E-07 0.00E+00 1.38E-06 0.00E+00 1.95E-06 CRU [kg] 0.00E+00 0.00E+00 0.00E+00 0.00E+00 0.00E+00 0.00E+00 0.00E+00 MR [kg] 1.59E-01 0.00E+00 6.73E-02 0.00E+00 0.00E+00 1.59E+00 0.00E+00 MER [kg] 0.00E+00 0.00E+00 0.00E+00 0.00E+00 0.00E+00 0.00E+00 0.00E+00 EEE [MJ] 0.00E+00 0.00E+00 1.74E-02 0.00E+00 0.00E+00 0.00E+00 0.00E+00 EET [MJ] 0.00E+00 0.00E+00 5.80E-03 0.00E+00 0.00E+00 0.00E+00 0.00E+00 Note: Comparisons cannot be made between product-specific or industry average EPDs at the design stage of a project, before a building has been specified. Comparisons may be made between product-specific or industry average EPDs at the time of product purchase when product performance and specifications have been established and serve as a functional unit for comparison. Environmental impact results shall be converted to a functional unit basis before any comparison is attempted. Any comparison of EPDs shall be subject to the requirements of ISO 21930. EPDs are not comparative assertions and are either not comparable or have limited comparability when they have different system boundaries, are based on different product category rules or are missing relevant environmental impacts. Such comparison can be inaccurate and could lead to erroneous selection of materials or products which are higher impact, at least in some impact categories. The estimated impact results are only relative statements, which do not indicate the endpoints of the impact categories, exceeding threshold values, safety margins and/or risks. The results presented herein include Modules A1-C4. Use of A1-A3 results without considering results of associated with Modules A5 and C1-C4 is discouraged as it does not accurately represent the full life cycle impacts of the product presented in this EPD, and in some instances (e.g., those relating to biogenic carbon) this can lead to misleading claims.
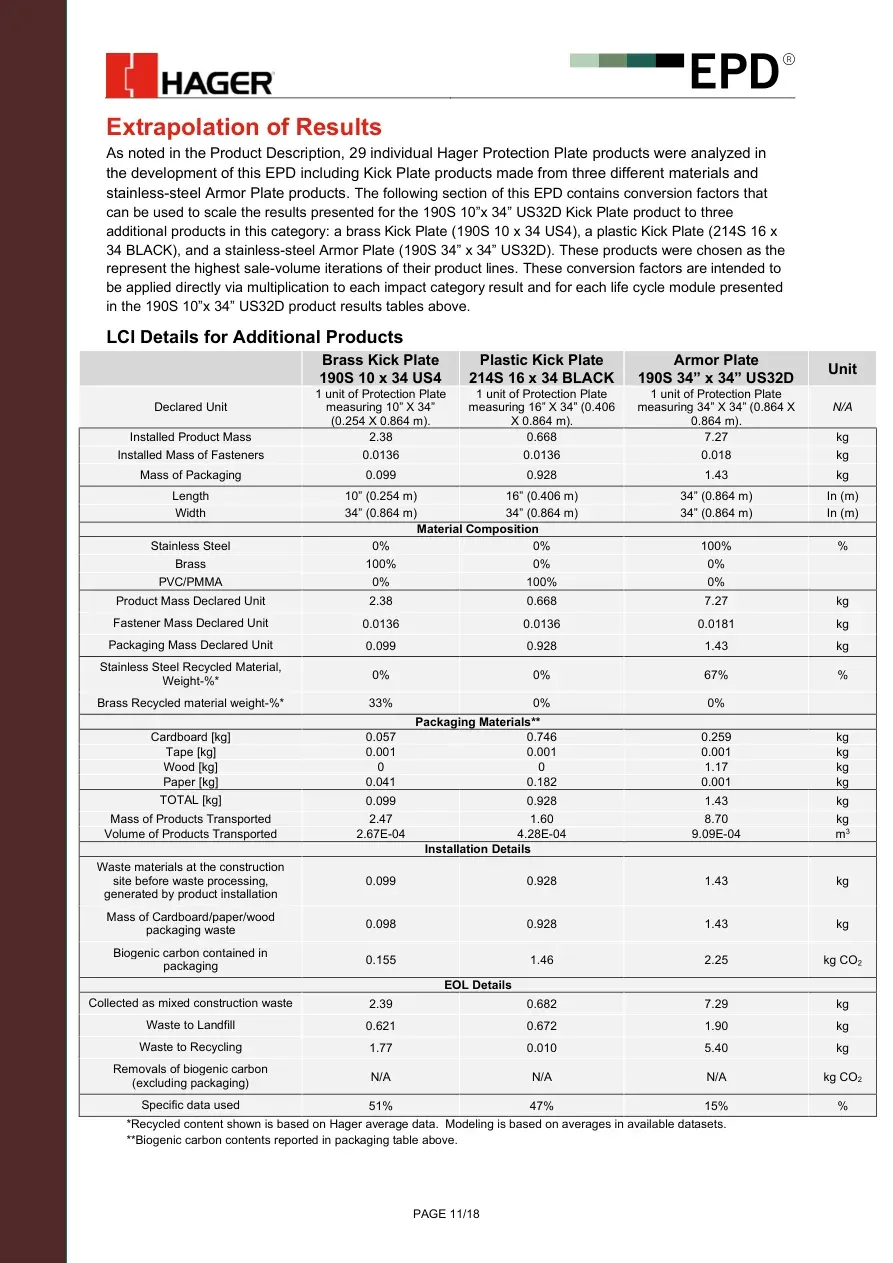
PAGE 11/18 Extrapolation of Results As noted in the Product Description, 29 individual Hager Protection Plate products were analyzed in the development of this EPD including Kick Plate products made from three different materials and stainless-steel Armor Plate products. The following section of this EPD contains conversion factors that can be used to scale the results presented for the 190S 10”x 34” US32D Kick Plate product to three additional products in this category: a brass Kick Plate (190S 10 x 34 US4), a plastic Kick Plate (214S 16 x 34 BLACK), and a stainless-steel Armor Plate (190S 34” x 34” US32D). These products were chosen as the represent the highest sale-volume iterations of their product lines. These conversion factors are intended to be applied directly via multiplication to each impact category result and for each life cycle module presented in the 190S 10”x 34” US32D product results tables above. LCI Details for Additional Products Brass Kick Plate 190S 10 x 34 US4 Plastic Kick Plate 214S 16 x 34 BLACK Armor Plate 190S 34” x 34” US32D Unit Declared Unit 1 unit of Protection Plate measuring 10” X 34” (0.254 X 0.864 m). 1 unit of Protection Plate measuring 16” X 34” (0.406 X 0.864 m). 1 unit of Protection Plate measuring 34” X 34” (0.864 X 0.864 m). N/A Installed Product Mass 2.38 0.668 7.27 kg Installed Mass of Fasteners 0.0136 0.0136 0.018 kg Mass of Packaging 0.099 0.928 1.43 kg Length 10” (0.254 m) 16” (0.406 m) 34” (0.864 m) In (m) Width 34” (0.864 m) 34” (0.864 m) 34” (0.864 m) In (m) Material Composition Stainless Steel 0% 0% 100% % Brass 100% 0% 0% PVC/PMMA 0% 100% 0% Product Mass Declared Unit 2.38 0.668 7.27 kg Fastener Mass Declared Unit 0.0136 0.0136 0.0181 kg Packaging Mass Declared Unit 0.099 0.928 1.43 kg Stainless Steel Recycled Material, Weight-%* 0% 0% 67% % Brass Recycled material weight-%* 33% 0% 0% Packaging Materials** Cardboard [kg] 0.057 0.746 0.259 kg Tape [kg] 0.001 0.001 0.001 kg Wood [kg] 0 0 1.17 kg Paper [kg] 0.041 0.182 0.001 kg TOTAL [kg] 0.099 0.928 1.43 kg Mass of Products Transported 2.47 1.60 8.70 kg Volume of Products Transported 2.67E-04 4.28E-04 9.09E-04 m3 Installation Details Waste materials at the construction site before waste processing, generated by product installation 0.099 0.928 1.43 kg Mass of Cardboard/paper/wood packaging waste 0.098 0.928 1.43 kg Biogenic carbon contained in packaging 0.155 1.46 2.25 kg CO2 EOL Details Collected as mixed construction waste 2.39 0.682 7.29 kg Waste to Landfill 0.621 0.672 1.90 kg Waste to Recycling 1.77 0.010 5.40 kg Removals of biogenic carbon (excluding packaging) N/A N/A N/A kg CO2 Specific data used 51% 47% 15% % *Recycled content shown is based on Hager average data. Modeling is based on averages in available datasets. **Biogenic carbon contents reported in packaging table above.

PAGE 12/18 190S 10” x 34” US4 Conversion factors for LCIA Results per declared unit. In this table, the “X” indicates multiplication and was included to visually differentiate results from extrapolation factors. Impact Category A1-A3 A4 A5 C1 C2 C3 C4 IPCC AR5 (2013) GWP [kg CO2] eq] X 0.76 X 1.07 X 1 - X 1.11 - X 1.11 TRACI LCIA Impacts (North America) AP [kg SO2 eq] X 1.21 X 1.1 X 1 - X 1.11 - X 1.11 EP [kg N eq] X 1.01 X 1.1 X 1 - X 1.11 - X 1.11 ODP [kg CFC 11 eq] X 1.11 X 1.01 X 1 - X 1.11 - X 1.11 SFP [kg O3 eq] X 0.66 X 1.1 X 1 - X 1.11 - X 1.11 CML LCIA Impacts ADPfossil [MJ] X 0.8 X 1.07 X 1 - X 1.11 - X 1.11 Resource Use Indicators RPRE [MJ] X 1.04 X 1.04 X 1 - X 1.11 - X 1.11 RPRM [MJ] X 1 - - - - - - NRPRE [MJ] X 0.8 X 1.07 X 1 - X 1.11 - X 1.11 NRPRM [MJ] X 1 - - - - - - SM [kg] X 1.93 - - - - - - RSF [MJ] - - - - - - - NRSF [MJ] - - - - - - - RE [MJ] - - - - - - - FW [m3] X 1.11 X 1.05 X 1 - X 1.11 - X 1.11 Output Flows and Waste Categories HWD [kg] X 1 X 1.08 X 1 - X 1.11 - X 1.11 NHWD [kg] X 0.85 X 1.04 X 1 - X 1.11 - X 1.11 HLRW [kg] X 0.79 X 1.01 X 1 - X 1.11 - X 1.11 ILLRW [kg] X 0.81 X 1.01 X 1 - X 1.11 - X 1.11 CRU [kg] - - - - - - - MR [kg] X 1 - X 1 - - X 1.11 - MER [kg] - - - - - - - EEE [MJ] - - X 1 - - - - EET [MJ] - - X 1 - - - -
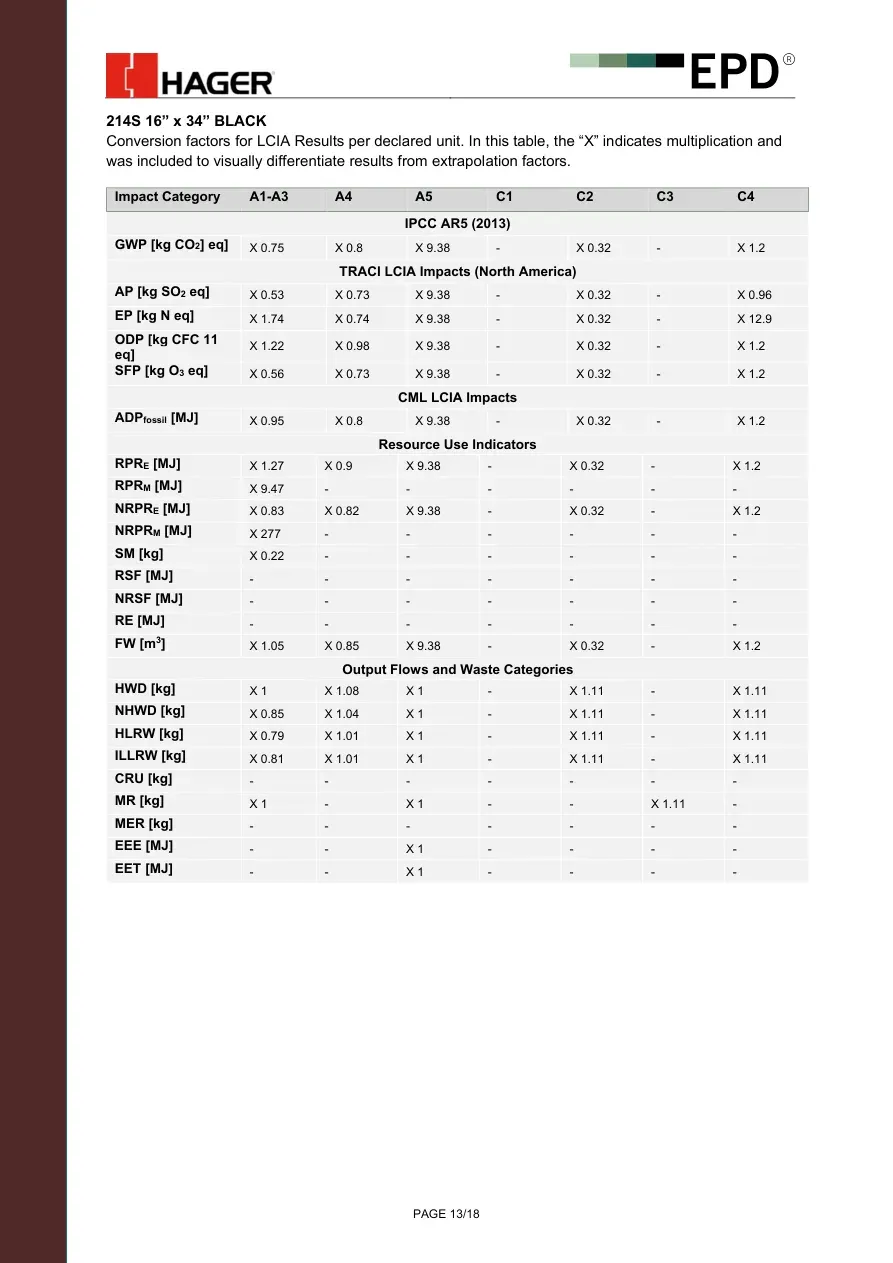
PAGE 13/18 214S 16” x 34” BLACK Conversion factors for LCIA Results per declared unit. In this table, the “X” indicates multiplication and was included to visually differentiate results from extrapolation factors. Impact Category A1-A3 A4 A5 C1 C2 C3 C4 IPCC AR5 (2013) GWP [kg CO2] eq] X 0.75 X 0.8 X 9.38 - X 0.32 - X 1.2 TRACI LCIA Impacts (North America) AP [kg SO2 eq] X 0.53 X 0.73 X 9.38 - X 0.32 - X 0.96 EP [kg N eq] X 1.74 X 0.74 X 9.38 - X 0.32 - X 12.9 ODP [kg CFC 11 eq] X 1.22 X 0.98 X 9.38 - X 0.32 - X 1.2 SFP [kg O3 eq] X 0.56 X 0.73 X 9.38 - X 0.32 - X 1.2 CML LCIA Impacts ADPfossil [MJ] X 0.95 X 0.8 X 9.38 - X 0.32 - X 1.2 Resource Use Indicators RPRE [MJ] X 1.27 X 0.9 X 9.38 - X 0.32 - X 1.2 RPRM [MJ] X 9.47 - - - - - - NRPRE [MJ] X 0.83 X 0.82 X 9.38 - X 0.32 - X 1.2 NRPRM [MJ] X 277 - - - - - - SM [kg] X 0.22 - - - - - - RSF [MJ] - - - - - - - NRSF [MJ] - - - - - - - RE [MJ] - - - - - - - FW [m3] X 1.05 X 0.85 X 9.38 - X 0.32 - X 1.2 Output Flows and Waste Categories HWD [kg] X 1 X 1.08 X 1 - X 1.11 - X 1.11 NHWD [kg] X 0.85 X 1.04 X 1 - X 1.11 - X 1.11 HLRW [kg] X 0.79 X 1.01 X 1 - X 1.11 - X 1.11 ILLRW [kg] X 0.81 X 1.01 X 1 - X 1.11 - X 1.11 CRU [kg] - - - - - - - MR [kg] X 1 - X 1 - - X 1.11 - MER [kg] - - - - - - - EEE [MJ] - - X 1 - - - - EET [MJ] - - X 1 - - - -
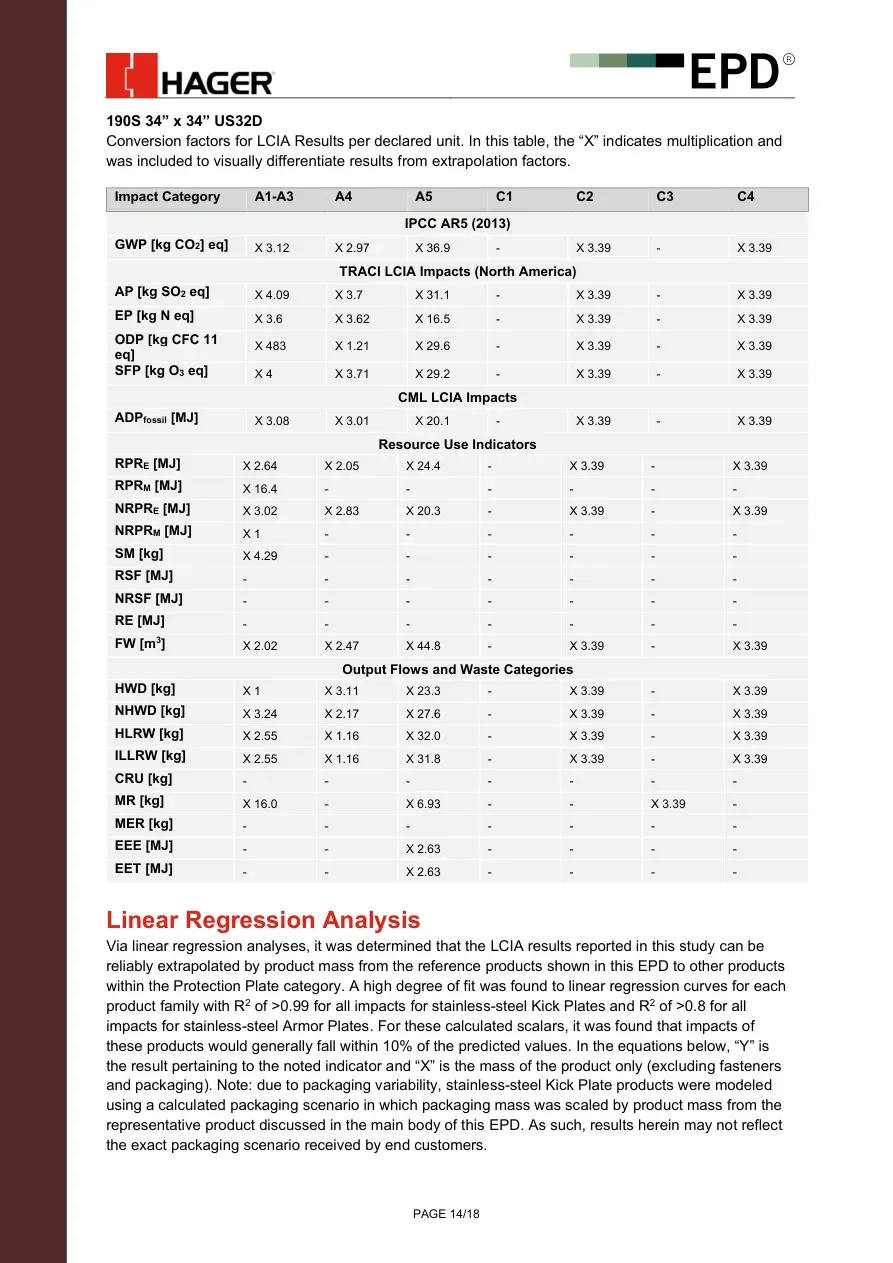
PAGE 14/18 190S 34” x 34” US32D Conversion factors for LCIA Results per declared unit. In this table, the “X” indicates multiplication and was included to visually differentiate results from extrapolation factors. Impact Category A1-A3 A4 A5 C1 C2 C3 C4 IPCC AR5 (2013) GWP [kg CO2] eq] X 3.12 X 2.97 X 36.9 - X 3.39 - X 3.39 TRACI LCIA Impacts (North America) AP [kg SO2 eq] X 4.09 X 3.7 X 31.1 - X 3.39 - X 3.39 EP [kg N eq] X 3.6 X 3.62 X 16.5 - X 3.39 - X 3.39 ODP [kg CFC 11 eq] X 483 X 1.21 X 29.6 - X 3.39 - X 3.39 SFP [kg O3 eq] X 4 X 3.71 X 29.2 - X 3.39 - X 3.39 CML LCIA Impacts ADPfossil [MJ] X 3.08 X 3.01 X 20.1 - X 3.39 - X 3.39 Resource Use Indicators RPRE [MJ] X 2.64 X 2.05 X 24.4 - X 3.39 - X 3.39 RPRM [MJ] X 16.4 - - - - - - NRPRE [MJ] X 3.02 X 2.83 X 20.3 - X 3.39 - X 3.39 NRPRM [MJ] X 1 - - - - - - SM [kg] X 4.29 - - - - - - RSF [MJ] - - - - - - - NRSF [MJ] - - - - - - - RE [MJ] - - - - - - - FW [m3] X 2.02 X 2.47 X 44.8 - X 3.39 - X 3.39 Output Flows and Waste Categories HWD [kg] X 1 X 3.11 X 23.3 - X 3.39 - X 3.39 NHWD [kg] X 3.24 X 2.17 X 27.6 - X 3.39 - X 3.39 HLRW [kg] X 2.55 X 1.16 X 32.0 - X 3.39 - X 3.39 ILLRW [kg] X 2.55 X 1.16 X 31.8 - X 3.39 - X 3.39 CRU [kg] - - - - - - - MR [kg] X 16.0 - X 6.93 - - X 3.39 - MER [kg] - - - - - - - EEE [MJ] - - X 2.63 - - - - EET [MJ] - - X 2.63 - - - - Linear Regression Analysis Via linear regression analyses, it was determined that the LCIA results reported in this study can be reliably extrapolated by product mass from the reference products shown in this EPD to other products within the Protection Plate category. A high degree of fit was found to linear regression curves for each product family with R2 of >0.99 for all impacts for stainless-steel Kick Plates and R2 of >0.8 for all impacts for stainless-steel Armor Plates. For these calculated scalars, it was found that impacts of these products would generally fall within 10% of the predicted values. In the equations below, “Y” is the result pertaining to the noted indicator and “X” is the mass of the product only (excluding fasteners and packaging). Note: due to packaging variability, stainless-steel Kick Plate products were modeled using a calculated packaging scenario in which packaging mass was scaled by product mass from the representative product discussed in the main body of this EPD. As such, results herein may not reflect the exact packaging scenario received by end customers.
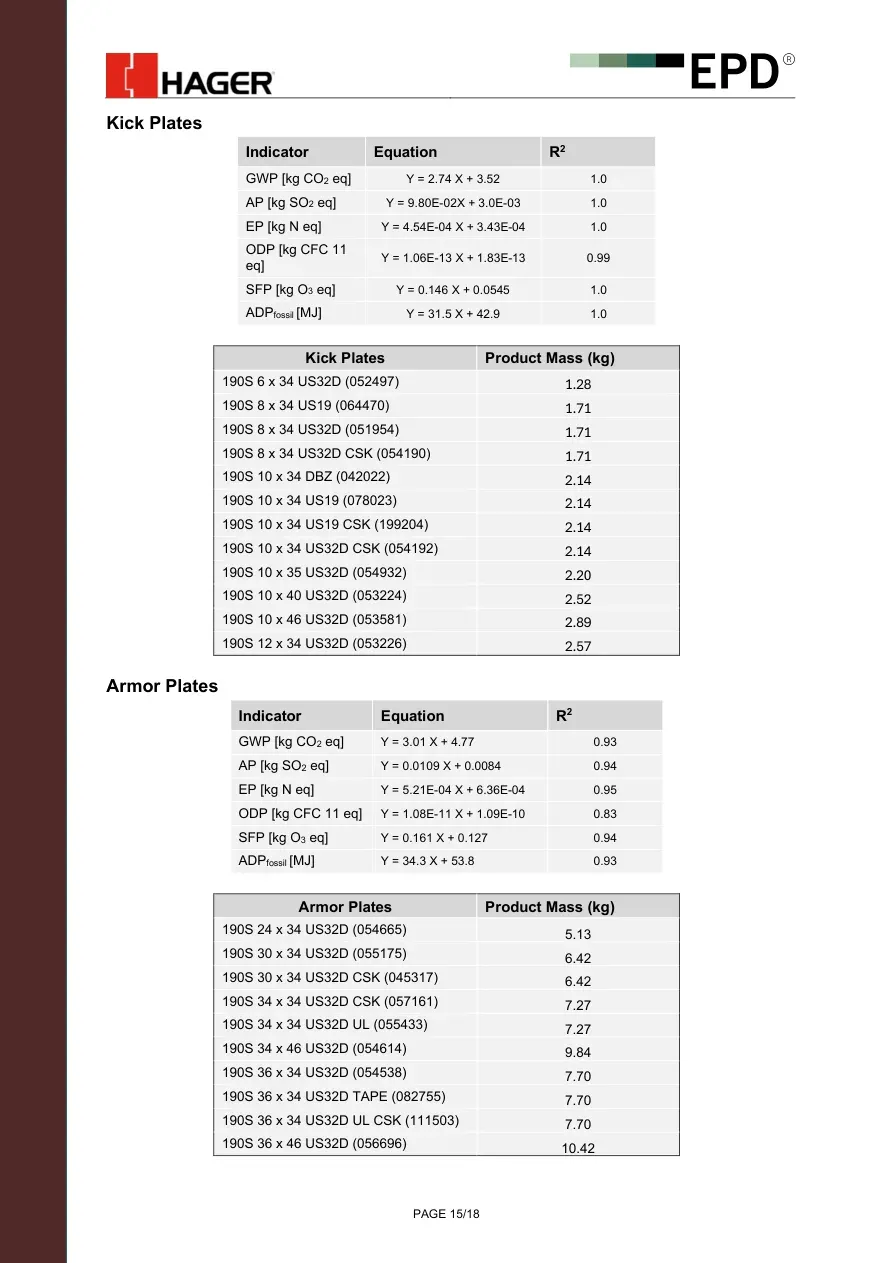
PAGE 15/18 Kick Plates Indicator Equation R2 GWP [kg CO2 eq] Y = 2.74 X + 3.52 1.0 AP [kg SO2 eq] Y = 9.80E-02X + 3.0E-03 1.0 EP [kg N eq] Y = 4.54E-04 X + 3.43E-04 1.0 ODP [kg CFC 11 eq] Y = 1.06E-13 X + 1.83E-13 0.99 SFP [kg O3 eq] Y = 0.146 X + 0.0545 1.0 ADPfossil [MJ] Y = 31.5 X + 42.9 1.0 Kick Plates Product Mass (kg) 190S 6 x 34 US32D (052497) 1.28 190S 8 x 34 US19 (064470) 1.71 190S 8 x 34 US32D (051954) 1.71 190S 8 x 34 US32D CSK (054190) 1.71 190S 10 x 34 DBZ (042022) 2.14 190S 10 x 34 US19 (078023) 2.14 190S 10 x 34 US19 CSK (199204) 2.14 190S 10 x 34 US32D CSK (054192) 2.14 190S 10 x 35 US32D (054932) 2.20 190S 10 x 40 US32D (053224) 2.52 190S 10 x 46 US32D (053581) 2.89 190S 12 x 34 US32D (053226) 2.57 Armor Plates Indicator Equation R2 GWP [kg CO2 eq] Y = 3.01 X + 4.77 0.93 AP [kg SO2 eq] Y = 0.0109 X + 0.0084 0.94 EP [kg N eq] Y = 5.21E-04 X + 6.36E-04 0.95 ODP [kg CFC 11 eq] Y = 1.08E-11 X + 1.09E-10 0.83 SFP [kg O3 eq] Y = 0.161 X + 0.127 0.94 ADPfossil [MJ] Y = 34.3 X + 53.8 0.93 Armor Plates Product Mass (kg) 190S 24 x 34 US32D (054665) 5.13 190S 30 x 34 US32D (055175) 6.42 190S 30 x 34 US32D CSK (045317) 6.42 190S 34 x 34 US32D CSK (057161) 7.27 190S 34 x 34 US32D UL (055433) 7.27 190S 34 x 46 US32D (054614) 9.84 190S 36 x 34 US32D (054538) 7.70 190S 36 x 34 US32D TAPE (082755) 7.70 190S 36 x 34 US32D UL CSK (111503) 7.70 190S 36 x 46 US32D (056696) 10.42
PAGE 16/18 Additional environmental information Environment and Health During Manufacturing Hager meets all federal and state standards related to the Environment and Health during manufacturing. Additionally, Hager has taken further steps to reduce the environmental and health impacts of our manufacturing process. These steps include: • Consolidated manufacturing and distribution efforts to reduce transportation (consuming less fuel and producing less emissions) and reducing inventory space (reducing our physical footprint) • Implementing recycling efforts for scrap metals and corrugated products • A wastewater pre-treatment facility at our Montgomery, Alabama, manufacturing plant that removes 98.5 percent of the soluble metals created during the manufacturing process and significantly reduces water consumption. • Implemented a corporate headquarters recycling program that single streams the recycling of paper, plastic, glass, metal, and other materials (diverting such waste from the landfill). Environment and Health During Installation The installation instructions found on Hager’s website can be referred to for proper and safe installation. Extraordinary Effects Fire: These products comply with the NFPA 80 Standard 6.4.5 for Protection Plates. Additionally, these products are UL Listed for use on fire rated openings per UL 10C Positive Pressure Fire Tests of Door Assemblies. Mechanical Destruction: No danger to the environment is anticipated from unforeseeable mechanical destruction of Protection Plate products. Many Hager products have been tested and approved for statewide acceptance Florida Building Commission pursuant to Rule 9B-72.090, F.A.C. This means they are suitable for use in regions impacted by severe wind and generally considered resistant to mechanical destruction. Additional information can be found at www.floridabuilding.org.
PAGE 17/18 References CML- Department of Industrial Ecology. (2016). CML-IA Characterization factors. Department of Industrial Ecology. International EPD System. (2024). General Programme Instructions of the International EPD System. Version 5.0. EPD International. IPCC. (2013). Climate Change 2013: The Physical Science Basis. Contribution of Working Group I to the Fifth Assessment Report of the Intergovernmental Panel on Climate Change. [Stocker, T.F., D. Qin, G.-K. Plattner, M. Tignor, S.K. Allen, J. Boschung, A. Nauels, Y. Xia, V. Bex and P.M. Midgley (eds.)]. Cambridge, United Kingdom and New York, NY, USA: Cambridge University Press. ISO. (2006). ISO 14025: Environmental labels and declarations - Type III environmental declarations - Principles and procedures. Geneva: International Organization for Standardization. ISO. (2006). ISO 14040/Amd 1:2020: Environmental management - Life cycle assessment - Principles and framework. Geneva: International Organization for Standardization. ISO. (2006). ISO 14044/Amd 1:2017/Amd 2:2020: Environmental Management - Life cycle assessment - Requirements and Guidelines. Geneva: International Organization for Standardization. ISO. (2017). ISO 21930: Sustainability in buildings and civil engineering works - Core rules for environmental product declarations of construction products and services. Geneva: International Organization for Standardization. UL Environment. (2018). Part A: Life Cycle Assessment Calculation Rules and Report Requirements, UL 10010, V3.2. US EPA. (2012). TRACI: The Tool for the Reduction and Assessment of Chemical and Other Environmental Impacts. Version 2.1 - User Guide. Retrieved from https://nepis.epa.gov/Adobe/PDF/P100HN53.pdf

www.environdec.com www environdec com
